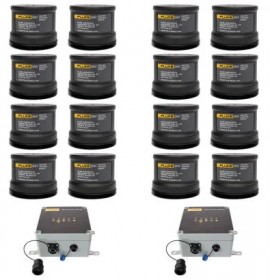
Model: 3563 16KIT
Monitor machine health with this analysis vibration sensor that uses high-frequency piezoelectric sensors, wireless gateway, and analytics software for vibration measurement analysis. Moreover, this kit includes 16 x vibration sensors, 16 x software subscriptions, 2 x gateways, and remote or onsite onboarding services.
Introducing the piezoelectric sensor combined with MEMS (microelectromechanical systems) sensors for a powerful solution to any condition-based maintenance program. Detect and measure changes in pressure, temperature, acceleration, strain, or force by converting these changes to electrical charges. Furthermore, this vibration sensor is ideal for various machine types and industrial equipment, prioritizing quality assurance, process control, research and development.
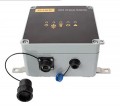
Track, monitor, and analyze vibration readings of an extensive portfolio of critical, semi-critical, and non-critical assets. Vibration data is transmitted wirelessly to the gateway and the cloud through Ethernet or Wi-Fi. Next, the data moves into the eMaint Condition Monitoring Software for analyzing data, events, and machine conditions. Moreover, this software allows users to identify the relevant data points, fine-tune data intervals, and customize data collection frequency and timing.
Receive guidance, support, and training from the included remote or onsite onboarding services throughout the configuration, commissioning, and installation process. In addition, remote condition monitoring services (sold separately) are available to further assist users in interpreting the data to obtain the best results.
Features
Deployment planning checklist:
How it works
What happens when the analysis sensor detects a fault?
Key eMaint Condition Monitoring Software
The software used to display the data from the sensor is called eMaint Condition Monitoring, and it's where users enter critical and semi-critical equipment information and configure the corresponding sensor. It takes just minutes to enter your data and get things up and running. Once the information is entered, users can see an overall view of equipment health via dashboards and vibration trending graphs. These insights enable experts to easily identify trends and quickly determine next steps depending on what the sensor data is telling them.
The wireless sensors help ensure essential components of a reliability program:
Simple steps for program succes
A little planning and preparation will help you smoothly install the analysis vibration sensor. By following the steps in our deployment planning guide, and with remote support from our experts, you’ll learn how to select your machines, sensor, gateway locations and learn about your network connectivity options. Follow this simple process for a successful setup:
Survey your plant and order initial system components
Monitor your success and grow the program to cover more assets: Document your savings to get buy-in and support from managers to purchase components for the next implementation phase.
Remote condition monitoring service (sold separately)
The sensor together with the remote condition monitoring service (sold separately) can ease your predictive maintenance journey. The pair combine to help maximize the success of condition monitoring programs thanks to a powerful sensor and direct access to service experts with decades of experience. This expert service supports machine fault analysis using the wireless vibration sensor, offering customers an end-to-end condition monitoring solution.
LIVE-Asset™ Portal Software (sold separately) application offers a straightforward configuration process for all experience levels
The software application leverages customizable and auto-generated thresholds based on machine details, vibration trending graphs, alarms and notifications. It also enables maintenance professionals to configure both banded overall values and narrowband values. With this capability, users can quickly screen out which machines are healthy or not. They can determine the fault causing a problem in an unhealthy machine and obtain insights to evaluate their next-step actions.
Overall, the configuration process within the LIVE-Asset™ Portal (sold separately) is user-friendly and intuitive. The ability to configure begins when someone puts asset information into the software. A new user starts the configuration through a button on the Settings page. During this process, the user can fill in asset details, components, test points, tasks and alarms, and device settings within each named asset
Asset details: Under the asset details, the user can include a description, Asset ID number, power (HP/kW), speed (RPM), and foundation type. The software requires the user to input the shaft speed (RPM) of the machine. A popup will appear in the tasks/alarms area to put in this information as a reminder. The RPM is critical to include because it helps build the auto-generated thresholds.
Components: The component area allows users to start defining their machines through the driver component and driven component. For example, the user would tell the software what features make up a centrifugal fan through the selections made.
Test point: The test point section is related to the best location (bearing) to get health and fault information about the machine. Information about the test points includes the name of choice, position on the machine, and sensor orientation. The user can have multiple test points on each machine.
Tasks and alarms: This box provides users the option of having the software set the alarm limits automatically based on a specific asset's information. The ability to have auto-generated information is a timesaver. It sets thresholds for the captured vibration measurements, including overall velocity and trends (velocity bands and acceleration bands).
Device settings: The setup incorporates a smart battery management capability that lets users decide on the data transmission rate, enabling them to choose how often data is collected and received in device settings, thereby allowing users to adjust and extend sensor battery life while still obtaining the necessary data. By selecting the appropriate rates for a particular machine, users can prolong battery life while still receiving the essential data needed to monitor asset health.
Dashboard and Insights: The dashboard provides users with a swift overview of each asset's basic details, encompassing active alarms, warnings, system errors, and connected devices, while also presenting the health status of facility assets through color coding- green signifies normal operation, yellow indicates a warning status, red signifies critical issues, and black denotes system errors.
Applications
| Measurement Interval (Overalls) | Configurable, default is every 30 minutes, minimum is every 10 minutes, and maximum is every 2 hours |
| Measurement Interval (Time Waveform) | Configurable for every 3, 6, or 12 hours |
| Frequency Range | 2 Hz to 10,000 Hz Z (2 Hz to 1000 Hz X, Y) |
| Amplitude Range | Z-axis: ±50 g X and Y-axis: ±16 g |
| Sampling Frequency | 218.5 to 62.5 kHz: ±3 dB |
| Range | Measurement: -4 to 185°F (-20 to 85°C) Storage: -4 to 185°F (-20 to 85°C) |
| Radio Frequency | 2.4 GHz ISM band according to IEEE 802.15.1 |
| Range (Line of Sight) | Up to 328' (100 m) depending on the environment |
| Shock Limit | 11 lbs (5000 g) peak |
| Power | Battery: 6 x 3.6 V 1/2 AA Li-SOCl 2 battery Battery lifetime: Up to 5 years based on cadence of scheduled measurements AD conversion: 24 bit |
| Ingress Protection Class | IP67 |
| Weight | 0.43 lbs (199.5 g) |
| Dimension | 2.6 x 2.1" (68 x 53.4 mm) |
Click on a category to view a selection of compatible accessories with the Fluke 3563 16KIT Analysis Vibration Sensors Kit.


We accept these payment methods:

We also accept wire transfers/EFT, cheques and purchase orders on approved credit. Accepted payment methods vary by country.