Model: 434-II | Order No: 434-II Series
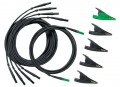
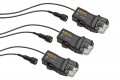
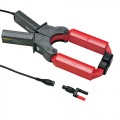
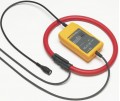
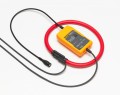
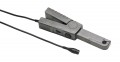
Delivers essential power quality monitoring and logging in a compact form. Use as a frontline troubleshooting tool, for predictive maintenance and for long-term load studies. Available as a stand-alone unit or a complete kit including 4x 6000A flexible current transformers.
Discontinued!
This product has been discontinued and is no longer available.
There is no direct replacement, however we recommend the:
Not what you're looking for? Let’s do a search and help you find what you need.
The Fluke 434 II Energy Analyzer is the ideal tool for energy logging. Utilizing the new Energy Loss Calculator function, the 434 II measures the fiscal cost of energy wasted due to poor power quality. This energy monetization capability allows you to identify the most energy-wasteful areas of your facility so you can determine potential energy saving solutions. Add basic power quality measurements to the package and you're got yourself one powerful troubleshooting tool.
The new 430 Series II Power Quality and Energy
Analyzers offer the best in power quality analysis
and introduce, for the first time ever, the ability
to monetarily quantify energy losses.
The new Fluke 434, 435 and 437 Series II
models help locate, predict, prevent, and troubleshoot power quality problems in three-phase
and single-phase power distribution systems.
Additionally, the Fluke-patented energy loss
algorithm, Unified Power Measurement, measures
and quantifies energy losses due to harmonics
and unbalance issues, allowing the user to pinpoint
the origin of energy waste within a system.

Fluke's patented Unified Power Measurement system (UPM) provides the most comprehensive view of power available, measuring:
These UPM calculations are used to quantify the fiscal cost of energy loss caused by power quality issues. The calculations are computed, along with other facility-specific information, by an Energy Loss Calculator that ultimately determines how much money a facility loses due to wasted energy.
Traditionally energy savings are achieved by monitoring and targeting, or in other words, by finding the major loads in a facility and optimizing their operation. The cost of power quality could only be quantified in terms of downtime caused by lost production and damage to electrical equipment. The Unified Power Measurement (UPM) method now goes beyond this to achieve energy savings by discovering the energy waste caused by power quality issues. Using the Unified Power Measurement, Fluke's Energy Loss Calculator (see screen shot below) will determine how much money a facility is losing due to waste energy.
UPM gives a more comprehensive breakdown of the energy consumed in the plant. In addition to measuring reactive power (caused by poor power factor), UPM also measures the energy waste caused by unbalance; the effect of unevenly loading each phase in three-phase systems. Unbalance can often be corrected by reconnecting loads on different phases to ensure the current drawn on each phase is as equal as possible. Unbalance can also be corrected by installing an unbalance reactance device (or filter), that will minimize the effects. Correcting unbalance should be basic good housekeeping in the facility as unbalance problems can cause motor failure or shorten equipment life expectancy. Unbalance also wastes energy. Using UPM can minimize or eliminate that energy waste, thus saving money.
UPM also provides details of the energy wasted in your facility due to the presence of harmonics. Harmonics may be present in your facility due to the loads you operate or may be caused by loads in adjacent facilities. The presence of harmonics in your facility can lead to:
Quantifying the cost of wasted energy due to the presence of harmonics simplifies the return-on investment calculation needed to justify purchasing harmonic filters. By installing a harmonic filter the ill effects of harmonics can be reduced and energy waste eliminated, resulting in lower operational costs and more reliable operation.


Measure true-rms, peak voltage and current, frequency, dips and swells, transients, interruptions, power and power consumption, peak demand, harmonics up to the 50th, inter-harmonics, flicker, mains signaling, inrush and unbalance.
User-configurable, long-term recording of MIN, MAX and AVG readings for up to 150 parameters on all 4 phases. Enough memory is available to record 600 parameters for over a year with 10 second resolution, or capture smaller variations with resolution down to 0.25 seconds. The logger function is quickly accessed by the LOGGER button, the simple step-by-step setup makes capturing your important measurements as easy as can be.
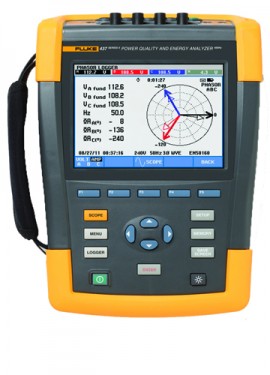
The MONITOR mode delivers a dashboard display of
rms voltage, harmonics, flicker, interruptions, rapid
voltage changes, swells, unbalance, frequency and
mains signaling.
The dashboard is updated live, showing compliance of each parameter to EN50160 limits or your
own limits. Color-coded bars clearly show which
parameters are inside (pass) or outside (fail) limits.
During a monitor session, you can easily drill
down to more detail of any parameter to view and
capture its trend for a report.
Every time an event or voltage distortion is detected, the instrument triggers and automatically stores voltage and current waveforms on all three phases and neutral. The analyzer will also trigger when a certain current level is exceeded. Hundreds of dips, swells, interruptions and transients can be captured this way. You can see voltage transients as high as 6 kV and as fast as 5 microseconds.
The Fluke 430 Series II analyzers provide three ways to analyze measurements. Cursors and zoom tools can be used "live" while taking measurements, or "off line" on stored measurement data. Additionally, the stored measurements can be transferred to a PC with the included software to perform custom analysis and create reports. Measurement data can also be exported to common spreadsheet programs. Store hundreds of measurement datasets and screen captures for use in reports (depending on memory capacity).
Pre-programmed setups and user-friendly screens make power quality testing as simple as you would expect from Fluke. The high-resolution color screen updates every 200 ms and displays waveforms and wiring diagrams color coded to industry standards. Handy on-screen wiring diagrams for all commonly used three-phase and single-phase configurations guide you through connections.
Designed to help protect you and your equipment, the Fluke 430 Series II analyzers and accessories are all certified to meet the stringent standards for use in CAT IV 600 V and CAT III 1000 V environments such as power connections and outlets throughout a low-voltage power distribution system.
| Model | ||||
| Model | Measurement range | Resolution | Accuracy | |
| Vrms (AC/DC) | 434-II | |||
| Vrms (AC/DC) | 434-II | 1 V to 1000 V phase to neutral | 0.1 V | ± 0.5% of nominal voltage**** |
| Vpk | 1 Vpk to 1400 Vpk | |||
| Vpk | Vpk | 1 Vpk to 1400 Vpk | 1 V | 5% of nominal voltage |
| Voltage Crest Factor (CF) | 1.0 > 2.8 | |||
| Voltage Crest Factor (CF) | Voltage Crest Factor (CF) | 1.0 > 2.8 | 0.01 | ± 5 % |
| Vrms½ | 434-II | |||
| Vrms½ | 434-II | 1 V to 1000 V phase to neutral | 0.1 V | ± 1% of nominal voltage |
| Vfund | 434-II | |||
| Vfund | 434-II | 1 V to 1000 V phase to neutral | 0.1 V | ± 0.5% of nominal voltage |
| Amps (AC/DC) | i430-Flex 1x | |||
| Amps (AC/DC) | i430-Flex 1x | 5 A to 6000 A | 1 A | ± 0.5% ± 5 counts |
| i430-Flex 10x | 0.5 A to 600 A | 0.1 A | ± 0.5% ± 5 counts | |
| 1mV/A 1x | 5 A to 2000 A | 1A | ± 0.5% ± 5 counts | |
| 1mV/A 10x | 0.5 A A to 200 A (AC only) | 0.1 A | ± 0.5% ± 5 counts | |
| i430-Flex 10x | 0.5 A to 600 A | |||
| Apk | i430-Flex | 8400 Apk | 1 Arms | ± 5 % |
| 1mV/A | 5500 Apk | 1 Arms | ± 5 % | |
| 1mV/A 1x | 5 A to 2000 A | |||
| A Crest Factor (CF) | A Crest Factor (CF) | 1 to 10 | 0.01 | ± 5 % |
| 1mV/A 10x | 0.5 A A to 200 A (AC only) | |||
| Amps½ | i430-Flex 1x | 5 A to 6000 A | 1 A | ± 1% ± 10 counts |
| i430-Flex 10x | 0.5 A to 600 A | 0.1 A | ± 1% ± 10 counts | |
| 1mV/A 1x | 5 A to 2000 A | 1A | ± 1% ± 10 counts | |
| 1mV/A 10x | 0.5 A A to 200 A (AC only) | 0.1 A | ± 1% ± 10 counts | |
| Apk | i430-Flex | |||
| Afund | i430-Flex 1x | 5 A to 6000 A | 1 A | ± 0.5% ± 5 counts |
| i430-Flex 10x | 0.5 A to 600 A | 0.1 A | ± 0.5% ± 5 counts | |
| 1mV/A 1x | 5 A to 2000 A | 1A | ± 0.5% ± 5 counts | |
| 1mV/A 10x | 0.5 A A to 200 A (AC only) | 0.1 A | ± 0.5% ± 5 counts | |
| 1mV/A | 5500 Apk | |||
| Hz | Fluke 434 @ 50 Hz nominal | 42.50 Hz to 57.50 Hz | 0.01 Hz | ± 0.01 Hz |
| Fluke 434 @ 60 Hz nominal | 51.00 Hz to 69.00 Hz | 0.01 Hz | ± 0.01 Hz | |
| A Crest Factor (CF) | 1 to 10 | |||
| Watts (VA, var) | i430-Flex | max 6000 MW | 0.1 W to 1 MW | ± 1% ± 10 counts |
| 1 mV/A | max 2000 MW | 0.1 W to 1 MW | ± 1% ± 10 counts | |
| Amps½ | i430-Flex 1x | |||
| Power factor (Cos j/DPF) | Power factor (Cos j/DPF) | 0 to 1 | 0.001 | ± 0.1% @ nominal load conditions |
| i430-Flex 10x | 0.5 A to 600 A | |||
| kWh (kVAh, kvarh) | kWh (kVAh, kvarh) | i430-Flex 10x | Depends on clamp scaling and V nominal | ± 1% ± 10 counts |
| 1mV/A 1x | 5 A to 2000 A | |||
| Energy loss | Energy loss | i430-Flex 10x | Depends on clamp scaling and V nominal | ± 1% ± 10 counts Excluding line resistance accuracy |
| 1mV/A 10x | 0.5 A A to 200 A (AC only) | |||
| Harmonic Order (n) | Harmonic Order (n) | DC, 1 to 50 Grouping: Harmonic groups according to IEC 61000-4-7 | ||
| Afund | i430-Flex 1x | |||
| Inter-Harmonic Order (n) | Inter-Harmonic Order (n) | OFF, 1 to 50 Grouping: Harmonic and Interharmonic subgroups according to IEC 61000-4-7 | ||
| i430-Flex 10x | 0.5 A to 600 A | |||
| Volts | %f | 0.0 % to 100 % | 0.1 % | ± 0.1% ± n x 0.1 % |
| %r | 0.0 % to 100 % | 0.1 % | ± 0.1% ± n x 0.4 % | |
| Absolute | 0.0 to 1000 V | 0.1 V | ± 5% * | |
| THD | 0.0 % to 100 % | 0.1 % | ± 2.5 % | |
| 1mV/A 1x | ||||
| Amps | %f | 0.0 % to 100 % | 0.1 % | ± 0.1% ± n x 0.1% |
| %r | 0.0 % to 100 % | 0.1 % | ± 0.1% ± n x 0.4 % | |
| Absolute | 0.0 to 600 A | 0.1 A | ± 5% ± 5 counts | |
| THD | 0.0 % to 100 % | 0.1 % | ± 2.5 % | |
| 1mV/A 10x | 0.5 A A to 200 A (AC only) | |||
| Watts | %f or %r | 0.0 % to 100 % | 0.1 % | ± n x 2% |
| Absolute | Depends on clamp scaling and V nominal | - | ± 5% ± n x 2 % ± 10 counts | |
| THD | 0.0 % to 100 % | 0.1 % | ± 5 % | |
| Hz | Fluke 434 @ 50 Hz nominal | |||
| Phase Angle | Phase Angle | -360° to +0° | 1° | ± n x 1° |
| Fluke 434 @ 60 Hz nominal | 51.00 Hz to 69.00 Hz | |||
| Plt, Pst, Pst(1min) Pinst | Plt, Pst, Pst(1min) Pinst | 0.00 to 20.00 | 0.01 | ± 5 % |
| Watts (VA, var) | i430-Flex | |||
| Volts | % | 0.0 % to 20.0 % | 0.1 % | ± 0.1 % |
| 1 mV/A | max 2000 MW | |||
| Amps | % | 0.0 % to 20.0 % | 0.1% | ± 1 % |
| Power factor (Cos j/DPF) | 0 to 1 | |||
| Threshold levels | Threshold levels | Threshold, limits and signalling duration is programable for two signalling frequencies | ||
| kWh (kVAh, kvarh) | i430-Flex 10x | |||
| Signalling frequency | Signalling frequency | 60 Hz to 3000 Hz | 0.1 Hz | |
| Energy loss | i430-Flex 10x | |||
| Relative V% | Relative V% | 0 % to 100 % | 0.10 % | ± 0.4 % |
| Harmonic Order (n) | DC, 1 to 50 Grouping: Harmonic groups according to IEC 61000-4-7 | |||
| Absolute V3s (3 second avg.) | Absolute V3s (3 second avg.) | 0.0 V to 1000 V | 0.1 V | ± 5 % of nominal voltage |
| Inter-Harmonic Order (n) | OFF, 1 to 50 Grouping: Harmonic and Interharmonic subgroups according to IEC 61000-4-7 | |||
| Volts | %f | |||
| %r | 0.0 % to 100 % | |||
| Absolute | 0.0 to 1000 V | |||
| THD | 0.0 % to 100 % | |||
| Amps | %f | |||
| %r | 0.0 % to 100 % | |||
| Absolute | 0.0 to 600 A | |||
| THD | 0.0 % to 100 % | |||
| Watts | %f or %r | |||
| Absolute | Depends on clamp scaling and V nominal | |||
| THD | 0.0 % to 100 % | |||
| Phase Angle | -360° to +0° | |||
| Plt, Pst, Pst(1min) Pinst | 0.00 to 20.00 | |||
| Volts | % | |||
| Amps | % | |||
| Threshold levels | Threshold, limits and signalling duration is programable for two signalling frequencies | |||
| Signalling frequency | 60 Hz to 3000 Hz | |||
| Relative V% | 0 % to 100 % | |||
| Absolute V3s (3 second avg.) | 0.0 V to 1000 V | |||
Click on a category to view a selection of compatible accessories with the Fluke 434-II Series of Power Quality Analyzers.


We accept these payment methods:

We also accept wire transfers/EFT, cheques and purchase orders on approved credit. Accepted payment methods vary by country.